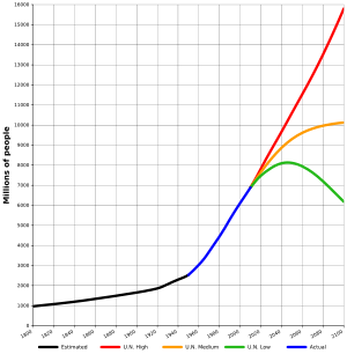
This graph shows the increase in world
population from 1800 to 2100.
Today we started a record of our personal water use for a week. Remember to keep it on you so that you can record water use right away so you won't forget!
We started a graph of World Population from 1750 to the present, and projected world population for 2050. Why? We did this to point out that the human population is increasing, but the amount of water on Earth stays the same. We will need to learn how to use water more efficiently as more people need to 'share the one well'.
Homework:
Math: Grade 6 get Percent test signed, and come to class with a Survey question and six possible responses and try this pictograph practice; Hong - sheet; Middleton p. 246/247 #8-15.
Social Studies: We are busy working on our Ancient Civilizations projects that are due on Friday! We know that we have to manage our work time at school and at home in order to complete it by Friday. Have an adult edit your writing. If you are making a hard copy for your presentation e.g. poster, picture book, print. We should be working on finishing up the project now. Leave a message about how your project is coming along.

 RSS Feed
